What is Portfolio Optimization?
…and how does it work?
This article is ideal for everyone who wants to know what portfolio optimization is and how it works. Our portfolio optimizer uses the results of revolutionary financial theory for cryptocurrency portfolio optimization. Learn why theory and practice is the same when it comes to asset management.
1. History
Harry M. Markowitz is the father of modern portfolio optimization. In 1950 he won the nobelprize in economic sciences for “pioneering work in the theory of financial economics”. His work had so much impact in the financial markets that many big funds changed their investment strategy and adapted Markowitz´ results.
2. Basic Considerations
Let´s begin with the very basics of capital market theory. Have you ever wondered, why the structure of professional investment funds looks more

Why is the weight of the blue investment bigger than the weight of the grey one? How did they choose the proportions?Because if they think the blue investment is the best, they could make it even bigger, couldn´t they?
The principles of many investment decisions lie in Markowitz theory. Markowitz did the following considerations:
- There´s always a best performing investment
- Nevertheless, investors typically hold more than one investment
- It´s not only about return but also about the risk of their investments
- The ratio between return AND risk must be important
- The return of the whole portfolio is only a weighted average of each single investment´s return
- Risk could be measured by variability (= volatility)
- How could investors optimize their portfolios?
3. What is risk?
When it comes to portfolio optimization you can define risk as the volatility of the portfolio value. Because if your portfolio has a high volatility it is more likely to have a big down-phase compared to a low volatility portfolio. Imagine you had a portfolio with zero variability and an average return of 30%, then you would safely get 30% value-growth per year. With a constant growth per day. Without ever having to worry about losses. That´s far from reality but with portfolio optimization you can minimize the risk you are taking without having to give up return.
4. Asset Allocation
Let´s take a look at shares. Imagine you own one share of an umbrella company and one share of an icecream factory. Now imagine there´s a big heat wave and the sun is shining all summer long. As a result the price of umbrella shares would drastically fall. That´s what we call unsystematic risk – it´s possible to diversify that away. But thanks to the icecream share you don´t loose any money, because the price of this share will rise. The only possible reason for a big loss in your (weather)diversified portfolio would be a (macroeconomic) recession. In a recession no one can afford a new umbrella or icecream for their kids. That´s what we call systematic risk – it´s not possible to diversify that away.
But is a 50/50 the best split for investing in Umbrella Inc. and Icecream Ltd.? Or is there any more efficient way to build a portfolio?
5. Two Asset Optimization
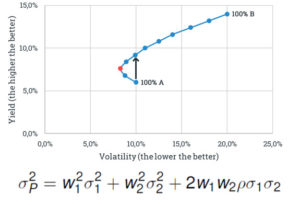
Let´s have a look at imaginary investments A and B. If you invest 100% of your money in A your estimated return is 6%and a volatility of 10%. However, if you invest all your money in B you will get an estimated return of 14% and a volatility of 20%.
If you combine those two assets, your portfolio return will be a weighted average of each investment´s yield. The volatility is not a linear function of the portfolio weights. The reason is the diversification effect that eliminates unsystematical risks. How?

That´s how.
This chart represents the possible portfolio structures of investment A & B. (100%A/0%B; 90%A/10%B; 80%A/20%B…0%A/100%B).
Take a closer look at the dot where it says “100% A”. Now look at the dot directly above this one. It has a higher (= better) yield and almost the same, but slightly lower (= better) volatility. This is the dot which represents the 40%A/60%B portfolio. Which one would you prefer? If you like return and don´t like unnecessary risk, you should say “the 40/60” portfolio. So this portfolio is more efficient than the 100%A portfolio.
What about the red dot? There´s no combination of investment A and B, that has a lower volatility (= risk) than this one. Every portfolio that lies beneath the red one is inefficient. Investors that see this graph would never buy one of the three beneath. Why the heck should they?
6. Multiple Asset Optimization
Let´s have a look at more than two assets.

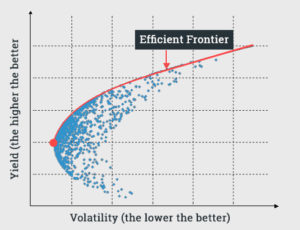
N-asset efficient portfolio frontier
Every blue dot represents a the risk/return structure of a portfolio combination. As you can see there are so much more possibilities to combine assets and build a portfolio if you have more than two assets. If you don´t want your portfolio to include unnecessary risk, you would never choose a portfolio beneath the red line. This line is called the efficient frontier.
The reason why is, that there´s always a portfolio combination with the same risk but more yield or vice versa: there´s always a portfolio with the same yield but less risk. The portfolio with the big red dot on the left side is called minimum variance portfolio. You could never invest in a less risky combination. Not even if you buy only one asset. Every single investment (or combination of investments) is more risky than this one, and often less rewarding.
There is also a portfolio that has the best ratio between risk and return. It´s called the maximum sharpe ratio portfolio. You can also call it tangency portfolio, because it is where the tangency through 0/0 and the efficient frontier touch each other.
That´s why gut feeling is not enough when it comes to asset allocation.
7. What about Cryptocurrencies?
Our cryptocurrency portfolio optimization tool allows you to calculate all those optimized portfolio structures for cryptocoins within seconds. Just select the cryptocurrencies you want to invest in and let our tool do the rest.
You want to know how the underlying calculation looks like?

portfolio risk based on the variance covariance matrix by Markowitz
This is a very basic presentation of our portfolio calculations.
8. Assumptions
Like every other financial model, Markowitz´ theory comes with a few assumptions.
Assumption #1: Investors estimate the risk of an investment on basis of variability of expected returns. (makes sense)
Assumption #2: The returns, correlations and volatility of different investments are estimated correctly. Well no one can say “hocus-pocus mumbo jumbo” and estimate those KPIs 100% correctly. Then we would all be millionaires within seconds. But using historical pricing data to estimate is the best alternative for the magical glass sphere.
If you´d like to try our cryptocurrency portfolio optimization tool click here. Don´t worry it´s free.